

When investors size up a real estate deal, the spotlight usually falls on cap rate, cash-on-cash return, or IRR. Those numbers matter, but they’re built on top of an assumption that often gets glossed over: how much of the property’s income goes toward operations. That’s where the operating expense ratio (OER) comes in, and it deserves far more attention than it typically gets, especially when underwriting deals.
What the Operating Expense Ratio Measures
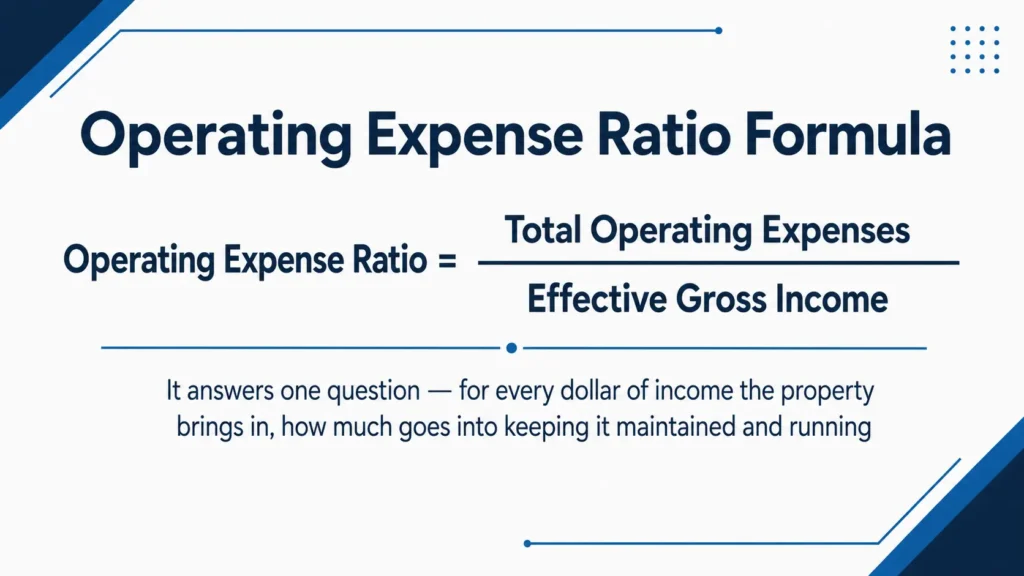
The operating expense ratio is a simple calculation: total operating expenses divided by effective gross income (or sometimes gross operating income). It answers one question: for every dollar of income the property brings in, how much goes into keeping it maintained and running?
Operating expenses in this calculation will almost always include property taxes, insurance, utilities, repairs and maintenance, property management fees, marketing, and administrative costs. Debt service, capital expenditures, and depreciation are usually excluded, since the OER is meant to isolate operational efficiency from financing structure and one-time capital decisions.
Why the Operating Expense Ratio Matters
It Reveals the True Cost of Ownership, Independent of Financing
Two identical properties can produce very different net returns depending on how they’re financed, which makes cap rate and cash-on-cash comparisons tricky across deals with different debt structures. The OER strips financing out of the picture entirely, letting you compare the underlying operational health of properties on equal footing.
It’s a Fast Sniff Test for Red Flags
A healthy OER for most residential properties tends to fall somewhere in the 35% to 50% range, while commercial and older properties often run higher, somewhere in the 50% to 60% range. When a deal’s OER comes in well outside the expected range for its asset class, that’s a signal to dig deeper. Maybe deferred maintenance is about to surface, maybe the seller’s numbers are optimistic, or maybe the property has structural inefficiencies like outdated systems or poor management.
It Exposes Seller Pro Formas That Are Too Good to Be True
Sellers and brokers want to present a property in its best light, and expenses are the easiest line items to project lower than true figures. A savvy buyer who understands typical OER benchmarks can spot when projected expenses look suspiciously low and push back with real numbers before accepting inflated return projections.
It Helps You Compare Apples to Apples Across Markets and Property Types
A single-family rental, a garden-style apartment complex, and a strip mall all carry very different expense structures, and those structures vary by market too. The OER gives investors a normalized way to evaluate operational efficiency across different asset types and locations, rather than relying on absolute dollar figures that don’t truly translate into comparable numbers.
It’s a Leading Indicator of Forced Rent Growth or Expense Creep
Watching how a property’s OER trends over time, rather than looking at it as a single snapshot, can reveal whether expenses are growing faster than income. That trend often shows up in the OER well before it shows up in a shrinking cash flow statement.
Where the Operating Expense Ratio Falls Short
Analyzing the operating expense ratio is just one part of a holistic approach to underwriting deals. The OER doesn’t account for financing costs or other items below the line (below NOI). Two properties with identical OERs can have wildly different net returns depending on leverage.
The OER also doesn’t include capital expenditures, meaning a property with a “good” OER could still be hiding a roof replacement or HVAC overhaul a year or two out. And because operating expense definitions can vary between sellers, brokers, and lenders, it’s always worth confirming exactly what’s included before comparing OER figures across deals.
Operating Expense Ratio: Final Thoughts
The operating expense ratio isolates operational efficiency from financing and market hype, giving investors a clear read on how well a property is actually managed. Pair it with cap rate, cash-on-cash return, and a close look at the expense detail behind it, and you have a much more complete picture of what you’re really buying.
On its own, the operating expense ratio won’t tell you whether a deal is a good or bad investment. No single metric will. That’s why thorough due diligence on every deal, paired with a real understanding of the market you’re investing in, is essential.
How BlueStar Consulting Approaches Operating Expense Ratio Analysis
BlueStar Consulting reviews operating expense ratios as part of its commercial real estate underwriting and due diligence work, benchmarking a seller’s projected expenses against comparable assets before a deal is priced. This analysis feeds directly into the broader financial modeling work BlueStar builds for each acquisition. Developers and investors who want a second look at a seller’s expense assumptions before committing capital can engage BlueStar for a deal-specific underwriting review.
Frequently Asked Questions
What is the difference between OER and the break-even ratio?
The operating expense ratio and the break-even ratio are related but answer different questions. OER measures only operating expenses against income, isolating operational efficiency from financing. The break-even ratio adds debt service into the calculation, dividing operating expenses plus debt service by gross operating income. It shows how much of a property’s income is needed just to cover costs and the mortgage, before any cash flow reaches the owner. A property can have a healthy OER and still carry high leverage risk that only the break-even ratio would reveal.
Does the operating expense ratio include vacancy loss?
No. OER is calculated using effective gross income, which already reflects income after vacancy and credit loss are deducted from potential gross income. Vacancy is accounted for before the ratio is calculated, not inside the expense side of the formula. This is worth confirming when reviewing someone else’s OER figure, since some sellers or brokers mistakenly calculate the ratio against potential gross income instead, which artificially lowers the reported percentage.
How often should investors recalculate OER during a hold period?
OER is most useful as a trend, not a one-time snapshot. Recalculating it quarterly, or at minimum annually, gives a much clearer picture than checking it only at acquisition. A rising OER over several periods, even a modest one, often signals expense creep before it shows up as declining cash flow. Investors managing a portfolio should track OER alongside occupancy and rent growth as part of routine asset management reporting.
Can OER be used to compare a value-add property to its stabilized pro forma?
Yes, and it’s one of the more useful applications of the metric. Comparing a property’s current, in-place OER against the OER assumed in a sponsor’s stabilized pro forma quickly shows how aggressive the renovation and expense-reduction assumptions really are. If the pro forma assumes an OER well below what comparable stabilized assets in the same submarket actually run, that gap deserves scrutiny before underwriting the deal on those numbers.