

One of these two numbers is a fact. The other is a guess dressed up as a number. Going-in cap rate is observed, calculated directly from the price you paid and the property’s actual income. Exit cap rate, also called terminal cap rate, is assumed: a forecast of what a buyer will pay for the same property years from now.
That single assumption typically does more to determine your projected return than almost anything else in the model. This article covers the formula for both, the market convention for the spread, a full worked example, and how to select and stress-test the number.
Going-In Cap Rate vs. Exit Cap Rate: The Core Distinction
Going-in cap rate is known at the moment you buy. Exit cap rate is a forecast about a sale that has not happened yet. Terminal cap rate and exit cap rate are the same concept under two names, used interchangeably across appraisal, DCF modeling, and everyday GP and LP conversation and waterfall projections. Both apply the identical formula, income divided by value, at opposite ends of a hold period.
What changes is which side of the equation is known and which side has to be assumed. For the general mechanics of cap rate itself, including the basic formula and the risk-return relationship across asset classes, see what is a good cap rate.
Going-In Cap Rate: Formula and Example
Going-in cap rate is the yield an investor locks in at acquisition, calculated from the price paid and the property’s actual current income.
The Acquisition Formula (NOI / Purchase Price)
Going-In Cap Rate = Year 1 NOI / Purchase Price
A property purchased for $10,000,000 with $600,000 in first-year NOI (net operating income) carries a going-in cap rate of 6.0%. Every input is known and observable at closing.
The Development Variant (Stabilized NOI / Total Project Cost)
For ground-up development, going-in cap rate uses stabilized NOI divided by total project cost: land, hard costs, soft costs, and financing combined. This variant, sometimes called yield on cost, measures the return on capital deployed to build the asset rather than to buy an existing one, a distinction most competing explanations skip entirely.
Exit (Terminal) Cap Rate: Formula and Example
Exit cap rate estimates a property’s future sale price by applying an assumed yield to the income the property is projected to generate at the point of sale.
The Terminal Value Formula (Projected NOI at Sale / Exit Cap Rate)
Terminal Value = Forward NOI at Sale / Exit Cap Rate
Forward NOI, or Year N+1 NOI, is the projected income for the year immediately following the sale, not the final year of ownership. A property projected to generate $695,000 in forward NOI at a 6.5% exit cap rate produces an estimated terminal value of approximately $10,700,000.
Why It’s an Assumption, Not a Calculation
Every input in the going-in formula is observable. Every input in the terminal cap rate formula is a forecast, projected future income and an assumed future market yield, neither of which exists yet. This is why exit cap rate deserves far more scrutiny than it typically receives in an offering memorandum. A single-point exit cap rate assumption, presented with no range, asks an investor to trust a forecast as if it were a fact.
Why Exit Cap Rate Is Usually Set Higher Than Going-In
Exit cap rate is conventionally underwritten wider than going-in, commonly 25 to 100 basis points depending on strategy, to account for property aging and market uncertainty.
Institutional and academic convention points to a general cushion of 50 to 100 basis points. More granular, strategy-specific guidance narrows the range: core deals warrant flat to 25 basis points, value-add deals commonly run 25 to 50 basis points wider, and opportunistic strategies often justify 50 to 100 basis points or more.
The table below synthesizes this convention into one usable reference.
| Strategy | Typical Spread (Exit vs. Going-In) | Why |
| Core | Flat to 25 bps | Stable, low-risk income; minimal repositioning risk |
| Value-Add | 25-50 bps | Renovation and re-leasing risk; property is older by sale |
| Opportunistic / Development | 50-100 bps | Higher execution risk and greater sensitivity to market timing |
As of 2026, these ranges reflect current institutional and practitioner convention and should be reviewed periodically as rates and capital markets shift. Many practitioners recommend stress-testing a further 75 to 100 basis points beyond the base assumption to confirm the deal still works under a genuinely adverse exit scenario.
Method 2: Deriving Your Exit Cap Rate from Market Fundamentals
Every convention-cushion figure above is a rule of thumb borrowed from institutional habit, not derived from your specific deal. A second, more rigorous method builds the terminal cap rate directly from current market fundamentals.
The Formula (Treasury Yield + Risk Premium – Inflation + Market Adjustment)
Exit Cap Rate = Treasury Yield + Risk Premium – Expected Long-Term Inflation + Quality/Market Adjustment
This is a bond-yield-plus-risk-premium build-up, combined with the Gordon Growth relationship that a cap rate equals a discount rate minus a growth rate. The discount rate builds from the risk-free rate, proxied by the 10-year Treasury yield, plus a real estate risk premium.
The growth rate is proxied by expected long-term inflation, a standard simplifying assumption for long-run NOI growth. The quality and market adjustment flexes the number for the specific property: negative for a superior asset, positive for an inferior one.
Worked Example, Cross-Checked Against the Convention-Cushion Method
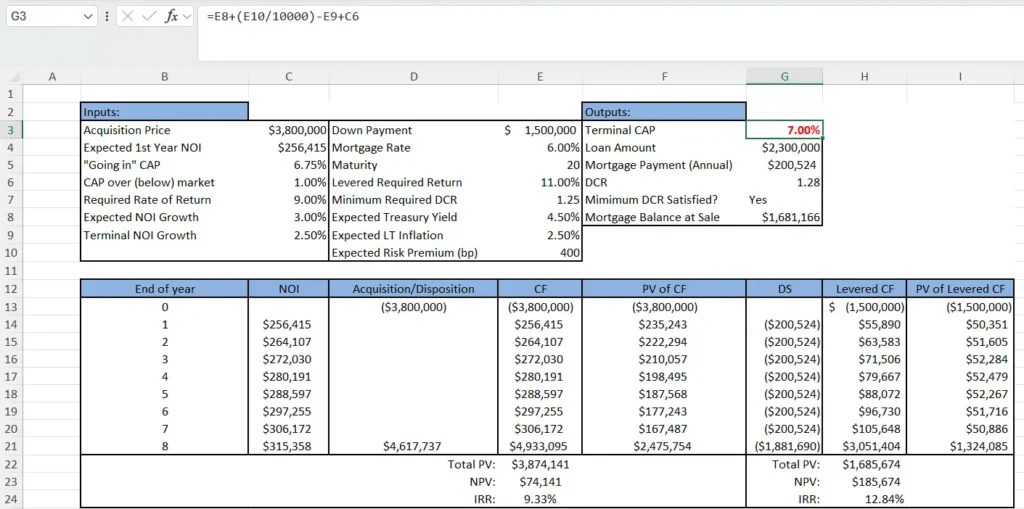
Using a Treasury yield of 4.5%, a risk premium of 4.0% (400 basis points), expected inflation of 2.5%, and a market adjustment of 1.0%, the formula produces 4.5% plus 4.0% minus 2.5% plus 1.0%, a 7.0% exit cap rate. Applied against a deal with a 6.75% going-in cap rate, this produces roughly a 25 basis point premium at exit.
That result is directionally consistent with the convention ranges above, but arrived at independently rather than through a borrowed rule of thumb. When the two methods diverge by a wide margin, that gap is diagnostic and worth investigating before finalizing an assumption.
A Full Worked Example: Going-In to Exit Across a 5-Year Hold
This example tracks one multifamily acquisition from purchase through a five-year hold to sale, showing exactly where the going-in number ends and the exit assumption begins.
An investor purchases a property for $10,000,000 with $600,000 in Year 1 NOI, a 6.0% going-in cap rate. NOI grows at 3% annually. By Year 6, forward NOI reaches approximately $695,564. Applying a 50 basis point cushion produces a 6.5% exit cap rate. Terminal value: $695,564 divided by 0.065, or approximately $10,700,000.
The deal is financed at 65% leverage, a $6,500,000 loan against the $10,000,000 price, with $3,500,000 in equity. Levered cash flow grows from $150,000 in Year 1 to $200,000 in Year 5. At sale, net proceeds after loan payoff and costs total approximately $4,194,000, combined with the final operating distribution for a total Year 5 cash flow near $4,394,000. Across this sequence, the deal produces a levered IRR of approximately 7.9%.
How Sensitive Is Your IRR to the Exit Cap Rate Assumption?
A small change in the exit cap rate assumption produces a disproportionately large change in projected IRR, since sale proceeds typically represent 60% to 80% of a deal’s total return. In the worked example above, moving the exit cap rate 50 basis points, from flat at 6.0% up to 6.5%, moves projected IRR from roughly 11.9% down to 7.9%. That is a swing of approximately 400 basis points from a single half-point change. You can run your numbers using BlueStar’s Consulting free interactive IRR Calculator.
The table below extends the same deal across a range of exit cap rate and NOI growth combinations.
| NOI Growth | Exit Cap 6.0% | Exit Cap 6.5% | Exit Cap 7.0% |
| 2% annual | ~10.1% IRR | ~6.1% IRR | ~2.9% IRR |
| 3% annual | ~11.9% IRR | ~7.9% IRR | ~4.6% IRR |
| 4% annual | ~13.7% IRR | ~9.7% IRR | ~6.4% IRR |
Figures are illustrative, derived from the worked deal above, and rounded for readability. Even in the most optimistic growth scenario, a full point of exit cap rate expansion moves projected IRR by more than 700 basis points. Presenting a sponsor’s underwriting at a single exit cap rate, with no table like this one, hides how much of the projected return depends on a number nobody can actually know in advance.
How to Actually Select Your Exit Cap Rate Assumption
A defensible exit cap rate starts from the known going-in rate, applies a strategy-appropriate cushion grounded in current convention, and gets cross-checked before it goes into a model.
Start With the Going-In Rate and Current Market Data
The going-in cap rate is your anchor, reflecting what the market is actually paying for comparable income today. Current cap rate survey data for the specific submarket should inform the starting point, not a figure carried over from a deal closed years earlier. Companies like Integra Realty Resources (IRR) regularly publish Viewpoint reports with cap rates accross various asset classes and states.
Apply a Convention-Based Cushion, Not a Hope-Based One
Select a spread from the strategy table above based on the deal’s actual risk profile, not the spread that makes the projection look best. A value-add deal modeled with a core-level 25 basis point cushion is understating its own risk.
Cross-Check Against the Market Fundamentals Method
Running the deal through the market fundamentals formula provides an independent second opinion. Significant divergence between the two methods signals a need to revisit the inputs on both sides.
Stress-Test Beyond Your Base Case
Add 75 to 100 basis points on top of the base assumption and confirm the deal still clears an acceptable return threshold. A deal that only works at the exact base-case exit cap rate is not underwritten. It is hoped for.
Common Mistakes With Exit Cap Rate Assumptions
Three mistakes account for most of the errors that surface in sponsor underwriting and first-time models alike.
Holding Exit Flat to Going-In
Assuming exit cap rate equals going-in cap rate ignores property aging and the genuine uncertainty of a future market. It is the most common shortcut, and it systematically overstates projected returns.
Assuming Cap Rate Compression to Make a Deal Work
Modeling an exit cap rate lower than going-in, meaning the market pays more for the same income than the investor did, requires a specific, defensible reason. Absent one, this assumption exists to make a marginal deal appear to work.
Presenting a Single-Point Exit Assumption With No Sensitivity Shown
An underwriting analysis showing one exit cap rate and one resulting IRR, with no range, conceals how much of the projected return rests on a single unverifiable number. A defensible model always shows the range.
How BlueStar Consulting Approaches Exit Cap Rate Underwriting
BlueStar Consulting builds exit cap rate assumptions into every financial model as a stress-tested range, cross-checking the convention-cushion approach against the market fundamentals method for each deal. Every terminal value calculation ties to a full sensitivity table connecting the exit cap rate assumption to IRR and equity multiple outcomes, not just sale price. Sponsors preparing an IC memo, and investors reviewing a sponsor’s stated exit cap rate assumption, can engage BlueStar for a deal-specific underwriting service review.
Frequently Asked Questions
Can the exit cap rate ever be lower than the going-in cap rate, and is that ever reasonable?
Yes, but it requires specific justification, not a default assumption. A lower exit cap rate is defensible with a concrete reason the market will value the income more favorably at sale. Examples include a supply-constrained submarket, a demonstrated repositioning into a lower-risk category, or a documented compression trend specific to that asset class. Without a specific reason, assuming compression is an aggressive assumption, not a defensible one.
Is exit cap rate the same thing as a discount rate in a DCF model?
No, and conflating the two is a common error. The discount rate brings every projected cash flow, including the terminal value itself, back to present value, reflecting the time value of money and overall investment risk. The exit cap rate only calculates the terminal value in the first place, converting forward NOI into an estimated sale price. That terminal value then becomes one of the cash flows the discount rate discounts.
What’s the difference between exit cap rate and reversion cap rate?
Nothing functionally. Reversion cap rate is a third name for the same concept as exit cap rate and terminal cap rate, more common in formal appraisal and academic literature. All three describe the same assumed yield applied to projected income at the end of a hold to estimate a future sale price.
Should I update my exit cap rate assumption during the hold period, or set it once at acquisition?
Set it initially at acquisition, but revisit it at each major underwriting checkpoint, typically annually or when refinancing is being evaluated. Market cap rates move with interest rates and capital markets conditions, and an exit cap rate assumption set three years earlier may no longer reflect current reality. Treating it as a fixed, one-time input is itself a common source of stale underwriting.
Does a higher exit cap rate always mean a worse outcome?
Not necessarily, though it usually pressures returns downward. Strong NOI growth can partially offset a wider exit cap rate, as shown in the sensitivity table above, where higher growth scenarios maintain a stronger IRR even at wider exit assumptions. Leverage and hold period also interact with this sensitivity: a shorter hold reduces the compounding effect of cap rate movement, while higher leverage amplifies both the upside and downside.
What if I don’t have access to institutional data sources like a cap rate survey? How do I estimate a reasonable exit cap rate?
The market fundamentals method above only requires publicly available inputs: the current Treasury yield, a general estimate of long-term inflation expectations, and a reasonable risk premium and quality adjustment for the deal’s own risk profile. This makes it accessible without a paid data subscription and produces a defensible, independently derived number that can be cross-checked against whatever convention guidance is available. BlueStar’s financial modeling team can help build and validate that inverstment analysis for sponsors and investors who want the assumption stress-tested.