
Most real estate financial models are built to confirm a decision already made. A model that actually earns its place in the process does the opposite: it identifies which assumptions have to hold for the deal to work, and shows how sensitive the returns are to the variables most likely to move against the sponsor. The difference between those two versions of a model determines whether a developer walks into a lender meeting with a defensible position or an optimistic narrative dressed as analysis.
A real estate financial model is a structured cash flow analysis that translates the physical, market, and financing characteristics of a property or development project into projected investment returns. At a minimum, it produces net operating income (NOI), leveraged internal rate of return (IRR), equity multiple, and cash-on-cash return under a defined set of assumptions.
A model built for decision-making also includes a sensitivity analysis that shows how those returns shift when critical assumptions change, and a downside case alongside the base case. That combination is what separates a model that informs a decision from one that merely supports a conclusion.
The Three Types of Real Estate Financial Models
The structure of a real estate financial model varies significantly by investment strategy. Acquisition, development, and value-add deals each carry a different cash flow logic, a different primary risk, and a different set of outputs that matter most for the go/no-go decision.
| Model Type | Typical Hold | Primary Inputs | Key Outputs | Primary Decision Question | Who Typically Uses It |
|---|---|---|---|---|---|
| Acquisition | 5-10 years | Purchase price, in-place NOI, rent growth, exit cap rate | Levered IRR, equity multiple, cash-on-cash | Does this asset generate returns above the hurdle rate at current pricing? | Investors, acquisitions analysts, asset managers |
| Development | 3-7 years | Land cost, hard and soft costs, stabilized rent, exit cap rate | Development margin, yield on cost, levered IRR | Do projected returns justify construction risk and the cash-negative carry period? | Developers, GPs, construction lenders |
| Value-Add | 3-5 years | Acquisition cost, renovation budget, stabilized NOI, exit timing | Levered IRR, equity multiple, cash-on-cash progression | Does the return on invested capital justify execution and lease-up risk? | Value-add sponsors, bridge lenders, LP co-investors |
The decision question differs for each model type, and so does the assumption that most threatens the projected return. In an acquisition model, the exit cap rate (capitalization rate, defined as NOI divided by asset value) tends to dominate. In a development model, construction cost and lease-up timeline carry the most risk. In a value-add model, the renovation budget and stabilized rent assumption are typically the inputs with the greatest uncertainty. A model that does not stress those assumptions individually has not done its job.
The Four Metrics a Model Should Produce
Every real estate financial model generates multiple outputs, but four are used consistently across deal types to determine whether a project proceeds to capital deployment.
| Metric | What It Measures | Typical Market-Rate Target |
|---|---|---|
| IRR (Internal Rate of Return) | Annualized return on equity over the full hold period, accounting for the time value of money | Core: 8–12% / Value-add: 13–18% / Development: 18–25% |
| Equity Multiple | Total distributions received divided by total equity invested; total capital returned per dollar, regardless of timing | 1.5x–2.0x for most hold periods; higher for development and opportunistic strategies |
| Cash-on-Cash Return | Annual pre-tax cash flow divided by total equity invested; current yield on equity before any exit event | 6–10% for stabilized acquisitions; lower in early years of value-add or development |
| Development Margin | Total project revenue minus total cost, divided by total cost; gross profit margin before debt and equity splits | 15–25% minimum on most market-rate projects; higher for complex or phased development |
No single metric tells the full story, and practitioners who rely on one at the expense of the others consistently misread deals.
- IRR rewards capital efficiency and can make a short hold with modest absolute profit appear superior to a longer hold with a larger total gain.
- Equity multiple corrects for that distortion by showing how many times invested capital returned, independent of timing.
- Cash-on-cash return captures current yield, which matters for investors with distribution obligations.
- Development margin establishes whether a project creates enough gross value to justify the execution risk before leverage and waterfall mechanics are layered in.
Evaluating all four together, with weighting determined by the investor’s time horizon and liquidity requirements, produces a complete picture that any single metric cannot.
Financial Model Snapshot
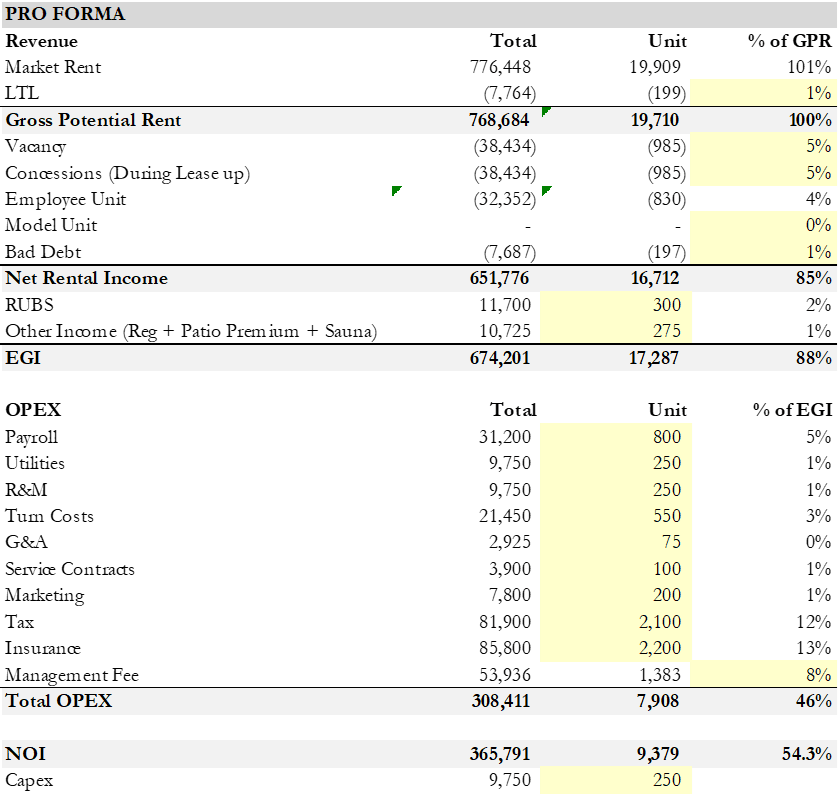
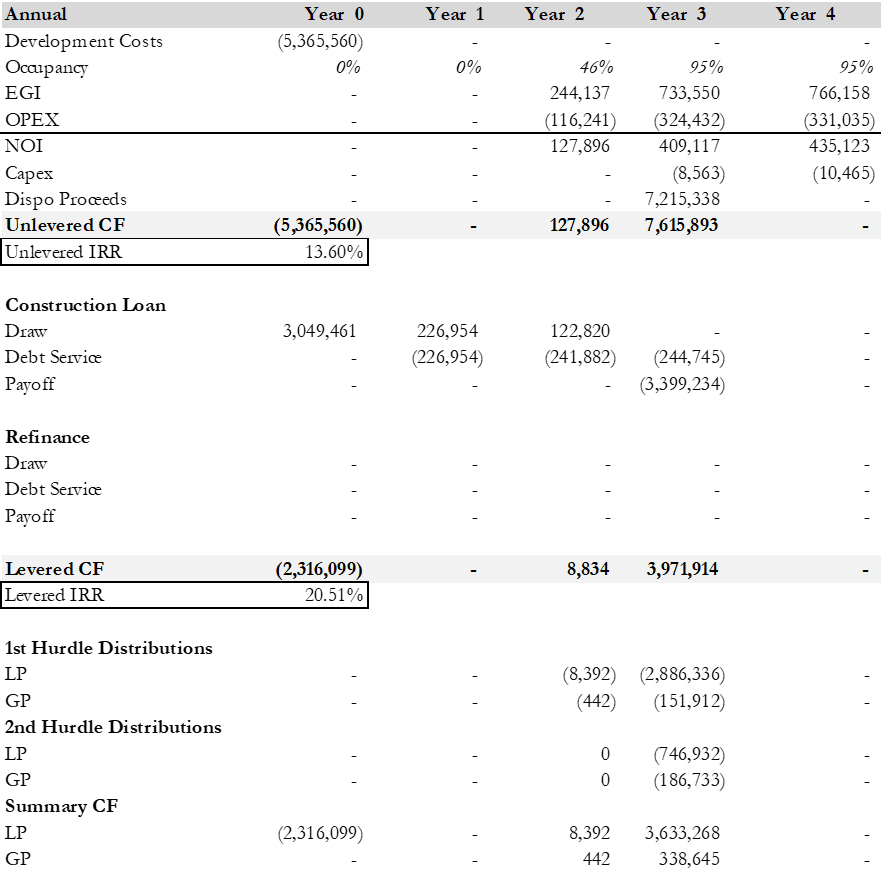
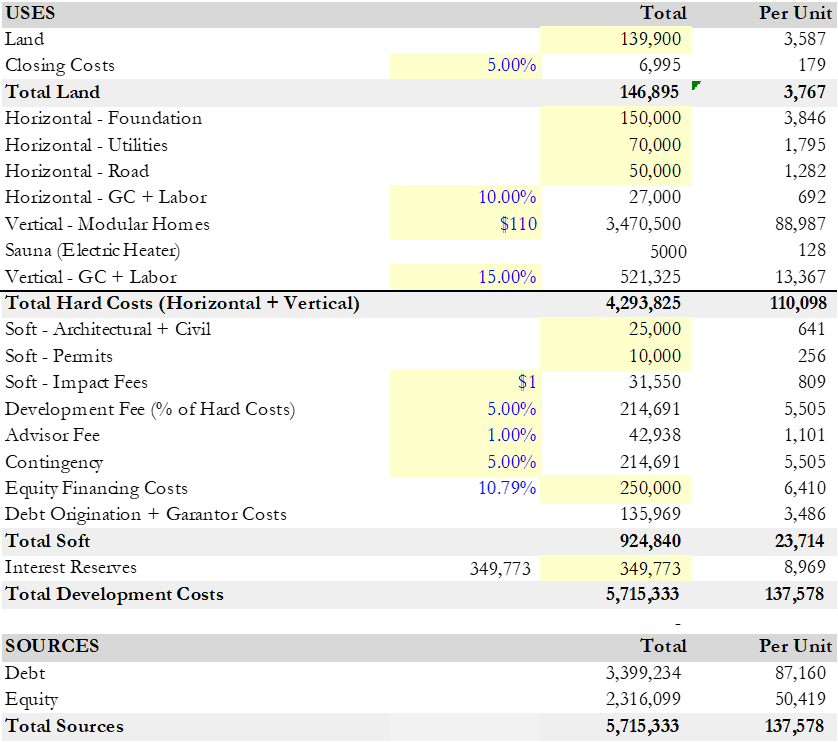
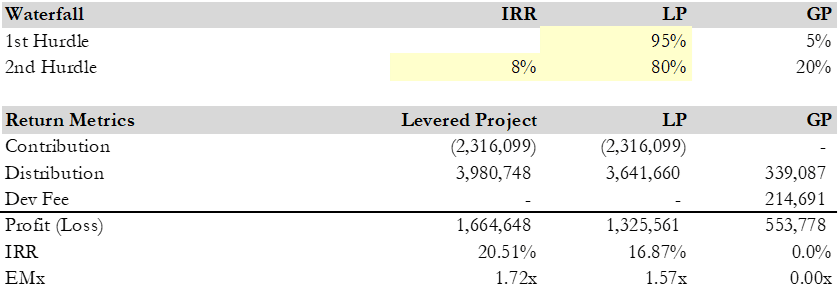
The snapshots below are from an actual multifamily value-add financial model produced by a BlueStar analyst. Every model we build follows the same structural logic: a sources and uses schedule that accounts for every dollar of capitalization before a line of code is written, a stabilized pro forma that builds from gross potential rent through NOI, annual cash flows presented on both an unlevered and levered basis, a waterfall structure that maps LP and GP distributions across each IRR hurdle, and a sensitivity matrix that stress-tests the primary return assumptions.
The depth of each section scales with the complexity of the deal. A 39-unit ground-up development requires more granularity in the hard cost build-out than a single-asset acquisition, but the analytical framework is consistent. What changes is how tightly each block is calibrated to the specific asset, submarket, and capital structure in front of us.
Pro Forma
Cash Flow
Budget: Sources and Uses
Waterfall Structure
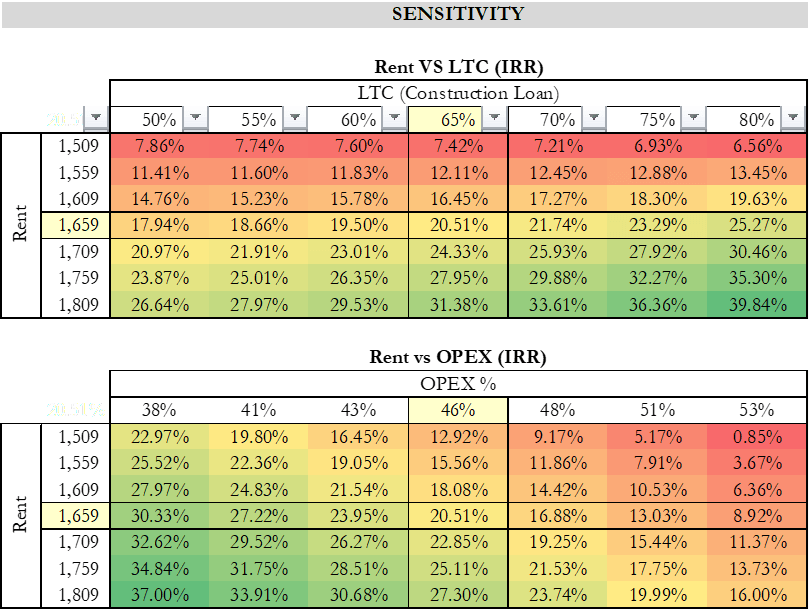
Sensitivity Analysis
Which Assumptions Drive Returns — and Which Get Manipulated
Most real estate financial models contain dozens of inputs, but a small set of assumptions account for the majority of return sensitivity. Identifying which inputs move the needle most is the critical skill in evaluating any model, whether built in-house or received from a third-party sponsor.
The three assumptions with the highest leverage on returns are the exit cap rate, rent growth, and, in development deals, construction cost per square foot. A 50 basis point increase in the exit cap rate on a property with $10 million in stabilized NOI reduces the projected sale price by roughly $1.7 to $2 million at current rate levels. A 5 percent reduction in projected rent growth over a five-year hold period compresses levered IRR by 150 to 300 basis points depending on leverage. In development, a 10 percent construction cost overrun on a project with a 20 percent development margin can reduce that margin by roughly half.
Assumptions that move the needle least and are frequently used to offset aggressive projections elsewhere are expense ratios beyond Year 1, vacancy beyond the initial stabilization period, and general and administrative cost growth. These inputs provide a convenient counterbalance when a sponsor needs the model to hit a return target despite aggressive rent or exit assumptions.
The credibility test for any assumption is simple: can the sponsor produce a data source that supports the specific submarket and product type, dated within the past twelve months? Rent growth grounded in metro-level averages rather than submarket lease comps is not supportable. An exit cap rate below where comparable stabilized assets are currently trading is not supportable.
A construction cost input without a current contractor quote or a completed comparable project as a reference is not supportable. According to The Crittenden Report’s 2026 CRE lending analysis, lenders in 2026 are applying explicit scrutiny to rent growth assumptions and exit scenarios that would have cleared review without question in 2021.
What Lenders and LPs Look for in a Financial Model
A construction lender and an institutional LP are reviewing the same model document with different questions in mind. Understanding both positions changes how a sponsor should structure the analysis.
Construction lenders focus on cost certainty, debt service coverage, and a demonstrable path from construction completion to stabilized cash flow. Per Commercial Loan Direct’s 2026 underwriting standards, minimum debt service coverage ratio (DSCR) requirements for most commercial real estate loans remain in the 1.20 to 1.35 range. For construction lending, where income is not yet stabilized, lenders shift their evaluation to projected stabilized DSCR, debt yield, sponsor liquidity, and completion risk.
The model needs to show a funded interest reserve, a realistic lease-up timeline supported by comparable absorption data, and a clear conversion path to permanent financing. CRE Daily’s January 2026 underwriting analysis noted that lenders now consider only assets with credible, funded renovation or leasing plans as financeable, with particular scrutiny on exit scenarios.
Institutional LPs are evaluating whether the sponsor has genuinely stress-tested the investment or simply built a model to hit a target return. A model with a single scenario, or a downside case that differs from the base case by a few percentage points on rent growth, signals the latter. LPs look for: multiple scenarios with meaningfully different assumption sets, a sensitivity matrix showing IRR across a range of exit cap rate and rent growth combinations, and a clear statement of what conditions would cause the deal to miss its hurdle rate.
The practical effect of the current lending environment is that LP diligence standards have converged with lender standards, because both groups learned from deals underwritten in 2021 that are now working through extension or modification.
How BlueStar Consulting Approaches Financial Modeling
BlueStar Consulting builds real estate financial models for developers, investors, and project sponsors across acquisition, development, and value-add strategies. Every model is structured as a decision-support tool: outputs include full sensitivity analysis, multiple scenario cases, and a clear identification of which assumptions are most critical to a deal’s viability.
Sponsors preparing for construction lender review, LP due diligence, or internal investment committee approval can engage BlueStar for model construction, independent review, or assumption validation against current market data.
Real Estate Financial Modeling Frequently Asked Questions
What is the difference between a real estate financial model and a pro forma?
A pro forma is a single-scenario income and expense projection, typically prepared by a seller or broker to present a property under favorable operating assumptions. A real estate financial model is a multi-scenario analytical tool that tests multiple assumption sets, produces sensitivity analysis, and is structured to identify the conditions under which a deal works or fails to reach its return threshold. A seller’s pro forma is a starting point. The financial model is the underwriting work that begins after the pro forma is received, not before.
What does a useful sensitivity analysis actually look like in a CRE model?
A useful sensitivity analysis presents the primary return metric, typically levered IRR, across a matrix of the two or three assumptions with the most leverage on returns: exit cap rate, rent growth at stabilization, and construction cost in development deals. A table with exit cap rate on one axis and rent growth on the other, showing IRR at each combination, gives the decision-maker a clear picture of how much can go wrong before the deal falls below its hurdle. Sensitivity analysis that tests only one variable, or that presents a downside case with inputs barely different from the base case, does not serve that purpose.
What is an equity waterfall, and when does it affect the model’s outputs?
An equity waterfall is the mechanism that determines how cash distributions and profits are divided between the GP (general partner or sponsor) and LPs (limited partners) at each stage of the investment. It matters in any co-investment structure: typically, the GP earns a higher share of profits once the LP has achieved a preferred return threshold. For LP investors reviewing a model, the waterfall directly affects how much of the projected IRR reaches their capital versus how much is captured by the sponsor’s promote. A model should always show LP-level distributions after the waterfall has been applied, not the gross project-level IRR before it.
Does a development model need to show both levered and unlevered returns?
Presenting both is best practice, and most institutional lenders and LPs will ask for unlevered returns if they are not already included. Unlevered IRR, sometimes called the project-level return, removes the effect of debt and shows the intrinsic return generated by the asset itself. Levered IRR shows the return on equity after debt service, which is what the equity investor actually earns. The spread between unlevered and levered IRR reveals how much of the return is generated by the business plan versus by leverage. A deal with a thin unlevered return and a high levered return is a leveraged bet, not a fundamentally strong project.
When in the development process should a financial model be built?
The model should be built before land is acquired or a letter of intent is signed, not after. Running the financial model at the site-selection or early feasibility stage allows the developer to work backward from required returns to determine the maximum land price, required rents, and acceptable cost parameters. Building the model after the acquisition has been decided removes its function as a decision tool and turns it into a rationalization document. That sequencing problem is the root cause of most development deals that fail to meet their underwritten returns.